Recent advances in batteries and pending changes in utility policies and rates regarding solar electric (photovoltaic or PV) systems has shown a need for background data. The Arizona Solar Center has prepared this report.
Most residential electric utility customers do not understand the challenges that utilities face with adapting and accommodating renewable energy.
Electric utility operations
The need for electrical power varies by:
- Time (seasonal, time of day, instantaneously as equipment cycles no and off, etc.) (see Need for Storage later in this document)
- Location (rural vs. urban)
- Type of equipment (lights, water pumping, smelting, heating/air conditioning, water heating, vehicle charging, etc.)
This varying demand for electrical power is always a challenge for utilities, and a direct cost. Many types of electrical generator cannot vary their output quickly (nuclear and hydro are examples), while others such as gas turbines can be varied and are used to match utility load to generation. Utilities spend considerable effort predicting loads and managing their resources in order to meet but not exceed the demand. Some generation sources, such as solar and wind will be by their nature intermittent (since the sun does not shine at night) and their absence will have to compensated by use of other resources. The challenge also includes minimizing the cost, the larger power plants that react relatively slowly have the lower cost per kWh (kilo-Watt-hour, the usual measurement of electrical energy).
The penalty for failure to match demand with generation is severe, outages and brown-outs (lower than normal voltage) can occur.
The ideal situation for a utility is constant demand, but that is not likely. The utilities have few tools available to them to encourage an easier to manage, more constant load. These include:
- Rate schedules that offer lower rates during periods of generally lower demand, and higher rates during periods of generally higher demand,
- Offering customers the availability of rates with a demand charge, but lower energy charges in order to have customers even out their energy usage,
- Offering incentives to customers to allow the utility to turn off some loads remotely when the utility is experiencing loads in excess of the available generation (water heaters, air conditioning, some commercial processes to name a few),
- Limiting the generation of power by sources that can more easily be cut back (large scale photovoltaic systems and most wind turbines).
Over decades the rate schedules in Arizona have been developed in order to somewhat balance the competing demands of the various classes of customers and the related legal situation. In Arizona the utilities have defined service areas and must service all customers on an equal basis. Rural customers generally cost more to serve than urban customers. Small customers cost more to serve than large customers, on a cost per KWH basis.
Due to many reasons, it is not practical to directly allocate utility costs to customer bills. Kind of related to the old economic impossibility of calculating the relative costs of steak, tallow, hide, etc. of beef when the costs are related to raising the whole animal. These economic problems are best solved by letting the market place establish the relative prices based on supply and demand. While the prices of commodities can vary quickly, few power users would be well served by waiting for a utility to determine actual costs before billing users.
In a perfect economic situation, a utility customer would be billed for electric services in direct accordance with the cost of providing the services. The basic services are the energy generation and the transport of the energy to the customer. The transport involves the requirement for equipment to carry the peak power requirement of the customers and is called “Demand”. Precise billing is not possible for many reasons because of the interplay of fixed and variable costs and the complex issues involved. To address this billing need, easy to implement rate schedules have been developed for the many classes of customers and for many reasons. These rates attempt to match costs with pricing for various classes of customer. As an example, APS presented the following comparison of Cost structure vs. Revenue Collections for residential customers:

Another way of looking at this:
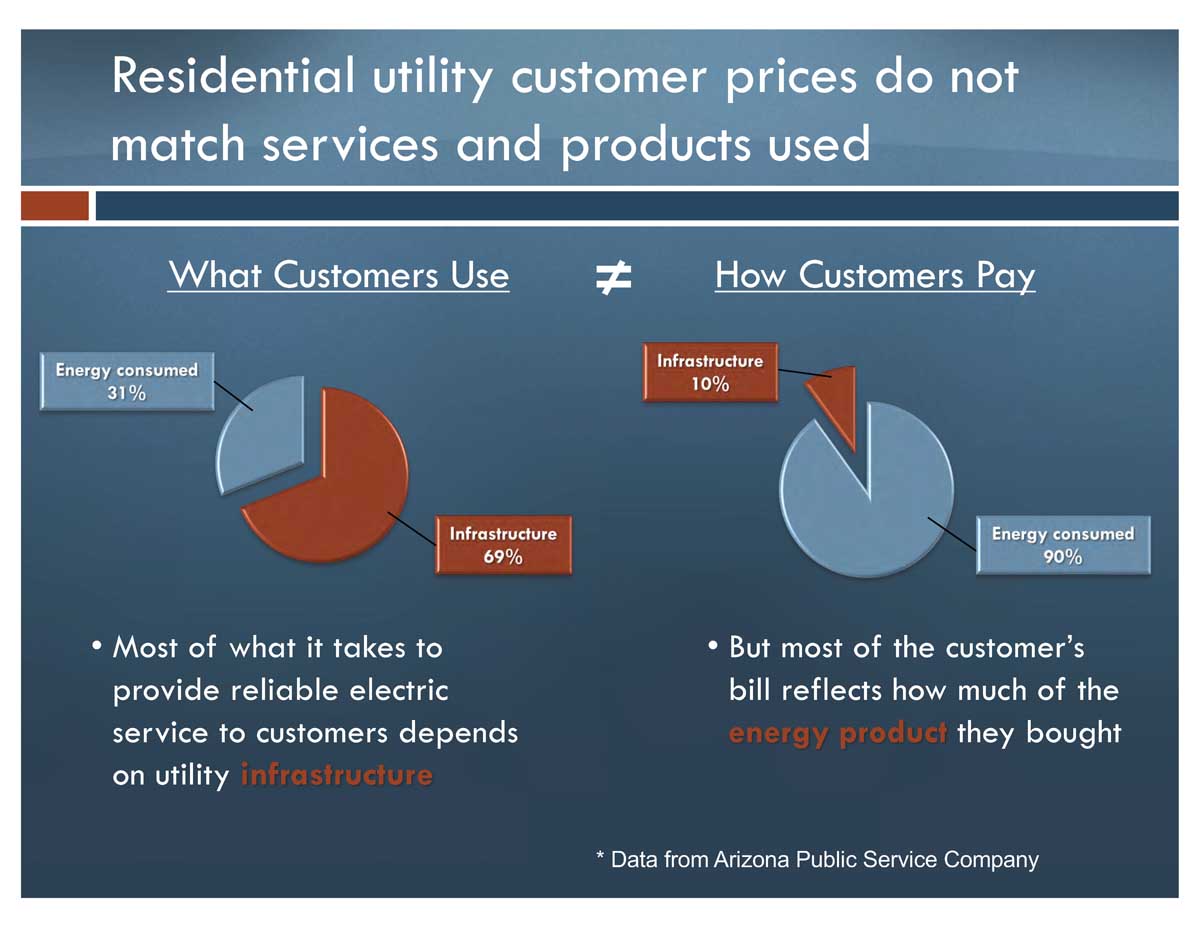
One consequence of this method of billing is that a utility recovers most of its residential fixed costs on the basis of residential customer energy use. As a result, when a customer reduces the energy used by installing a PV system or solar hot water system, the customer’s contribution to the fixed costs decreases, but there is not a proportionate decrease in the utility fixed costs. When DG (Distributed Generation) is a small portion of the utility energy mix, this imbalance is insignificant compared to the costs and problems involved in modifying the overall utility rate structure to better match revenues by customer class with the costs of serving the customers. The above APS illustration (other utilities are similar, but APS has provided a good graphic representation at a metering workshop) illustrates the mismatch.
This is the overall result of literally dozens of rate structures that are available to APS residential customers that range from fixed flat rates (energy not charged for such as street lights) to billing based on energy used and demand by time of use. While the revenue values are accurate, the allocation of costs between residential and commercial customers is not an exact science, but this is close. The variable revenue is based on both energy consumed and demand charges that reflect the peak loads imposed on the utility and the amount of equipment required to provide the energy.
The obvious question is ‘Why do these percentages not have a closer match?’ There are hundreds of reasons ranging from the need to provide universal service to customers within the service territory to a political need to treat some customers differently. That is beyond this discussion.
The proportion of fixed and variable (energy and demand) customer charges in a rate is of high interest for DG (Distributed Generation- such as customer PV systems) because DG sources reduce variable charges. The variable part of a utility rate includes Energy (measured in kilowatt-hours) and peak demand (measured in kilowatts). Peak demand is reflective of customer “usage” or “burden” on the utility distribution system.
Impact of DG
As renewables such as solar and wind become more significant in the mix of generation resources in Arizona, they will affect how each utility addresses the operational and revenue issues. Solar and wind bring both benefits and challenges into the generation and usage related issues in operating a reliable utility system (a legal requirement placed on the utilities). A customer benefit may be a challenge to the utility. Society as a whole benefits when the environment is improved, but is this benefit reduced if the utility reliability is reduced?
DG brings many benefits to the Utility; PV systems help utilities avoid the most expensive power for much of the afternoon, save costs of adding infrastructure (customers make the investment), and reducing loading on transmission lines.
The overall discussion of the costs of solar vs. benefits of solar are beyond the scope of this report.
The need for Storage
In commercial-scale electricity generation, the ‘duck’ curve is a graph of power production over the course of a day that shows the timing imbalance between peak demand and renewable energy production.
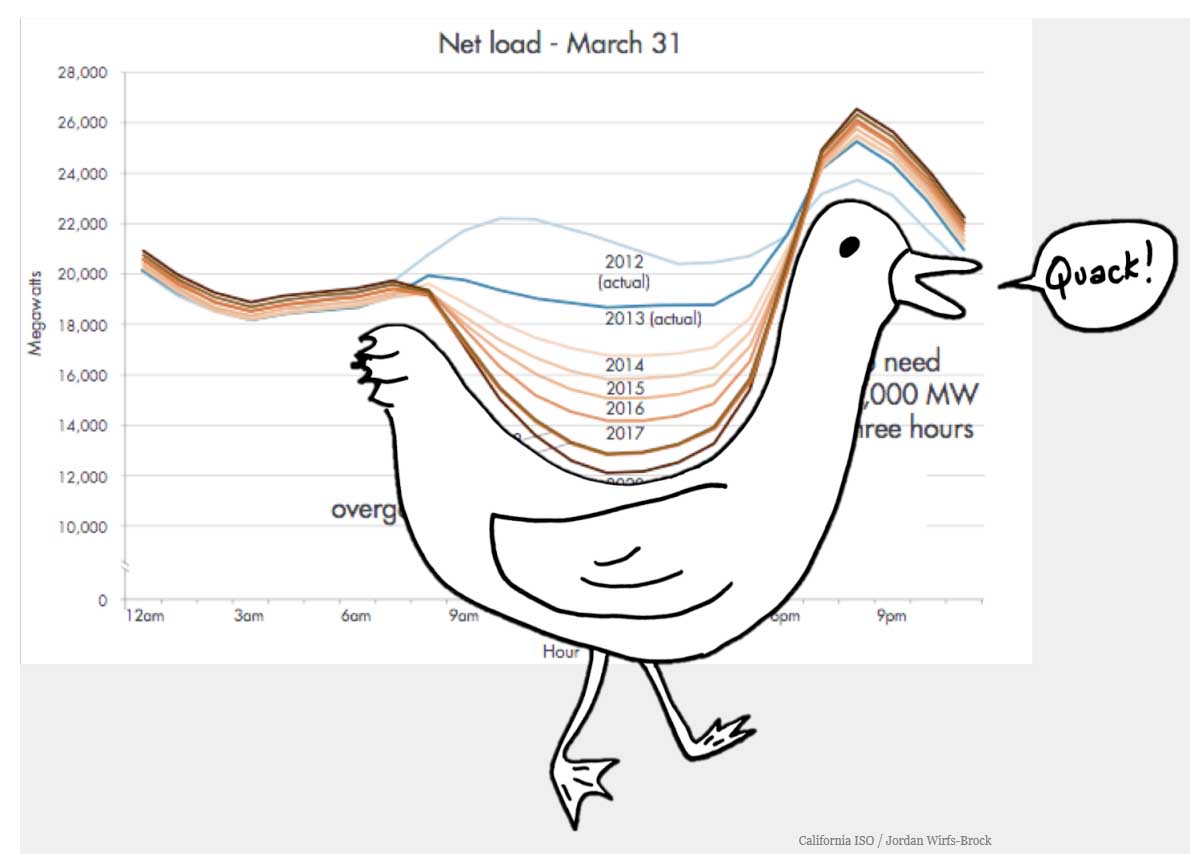
The dip in this curve, increasing in proportion to installed solar capacity, illustrates the utility problem in meeting demand in the early evening. Energy storage can be used reduce the ‘head’ by transferring energy from daytime to evening.
The role of storage
The concept is simple, but expensive to implement- Store excess energy from periods of low demand relative to energy availability, and use the energy during peak times. The storage can be batteries, pumped water, compressed air, etc. There is both a value and a cost with using energy storage. The value of storage in a utility connected situation depends highly on the usage pattern and the selected utility rate schedule. Taking APS bundled standard residential summer rates (May 2017, subject to change in a few months) as an example:
|
Rate
|
On-Peak period
|
$ per kWh
|
$ per kW
|
|
|
|
On-peak
|
Off-peak
|
|
|
TIME ADVANTAGE
|
NOON -7PM M-F
|
$ 0.24477
|
$ 0.06118
|
No demand charge
|
|
COMBINED ADVANTAGE
|
NOON -7PM M-F
|
$ 0.08867
|
$ 0.04417
|
$13.500 per On-Peak kW
|
Before considering homes with PV systems, the possible effect of storage on energy costs is as follows:
- Under TIME ADVANTAGE storage can be used to shift Off-peak energy worth $ 0.06118 per kWh to On-peak periods when the energy is worth $ 0.24477 per kWh, a savings of $0.18359 per kWh.
- Under the COMBINED ADVANTAGE rate, the energy cost savings is only $0.0445 per kWh, but proper usage of storage during On-peak periods can reduce demand charges by $13.500 per On-Peak kW. Savings depend on using the storage when it produces the most savings.
Under TIME ADVANTAGE if the lifetime cost of the storage is less than $0.18359 per kWh, then there is a savings. It is difficult to calculate this lifetime cost because storage (typically batteries) life depends on many variables such as depth of discharge, ambient temperature, cost of the capital involved, etc. (Estimate the cost per kWh shifted by dividing the cost of the battery system by the total number of kWh that will be shifted over the life of the battery)
Under COMBINED ADVANTAGE it is far more difficult to project savings that will be mostly due to reducing the demand charges. Most utility customers who select the COMBINED ADVANTAGE rate will take steps to either manually or automatically reduce demand. Manually includes changes in life style such as limiting high energy use during the peak periods (A/C off, water heater off, no baking, etc.) or automatically with a device called a load controller. While it is easy to look back and see when peak usage occurred and when storage could have been used, it is very difficult on an instantaneous basis to determine when to commit limited storage to reduce monthly demand when a future period may occur after the battery has been discharged. Some companies are providing an internet ‘cloud’ service wherein a computer learns usage patterns and applies services such as weather forecasting and utility rates to determine the most likely period of high demand and when to us any available storage. The same process is used to recharge the battery with lower cost energy.
Adding PV to the analysis
If a home has a PV system, the foregoing analysis is more difficult and depends on the relative sizes, and the utility policy for instantaneous excess local generation (net metering, etc.). The following discussion assumes net metering and the APS EPR-6 rate (soon to be modified). Under the current May 2017 net metering policy an APS customer using TIME ADVANTAGE or COMBINED ADVANTAGE rate plans will have essentially two net metering accounts, On-peak and Off-peak. Any excess generation remaining on either account is credited at $0.02868/kWh (off-peak) or $0.02943/kWh (on-peak) at the end of the year. Any excess on-peak kWh cannot be used to meet off-peak usage. If the relative size of the PV system results in excess off-peak energy and a need for on-peak energy, storage may be carefully used to shift some off-peak energy to on-peak periods. This has to be done carefully as shifting too much may result in an annual surplus in the on-peak account that is worth only $0.02943/kWh.
Some families have adapted well to TIME ADVANTAGE, such that a PV system that faces South to West and is sized to produce only 65-70% of the annual usage will produce 100% of the on-peak energy. This means that any increase in PV system size will only serve to produce excess on-peak energy worth only $0.02943/kWh and off-peak energy worth $0.06118/kWh. It is difficult to justify the cost of storage in such a situation.
Private storage vs. Utility storage
In theory, utilities could use high capacity storage to shift vast quantities of energy in order to level the balance between generation and demand. At present (May 2017) utility scale storage is still in the research mode. Tucson Electric Power (TEP) is testing a 10 MW , 4-hour battery and SRP plans on testing a similar system. APS has a few feeder storage systems (2 MW). When and if such storage becomes economically viable, it will be more cost effective than local customer storage.
Residential solar users considering adding battery storage to their PV system need to consider if the additional cost of a battery system will produce savings that justify the additional investment. Since future utility rates (On-Peak, Off-peak, excess, demand as per the earlier discussion) are not well defined, the exact savings cannot be calculated.
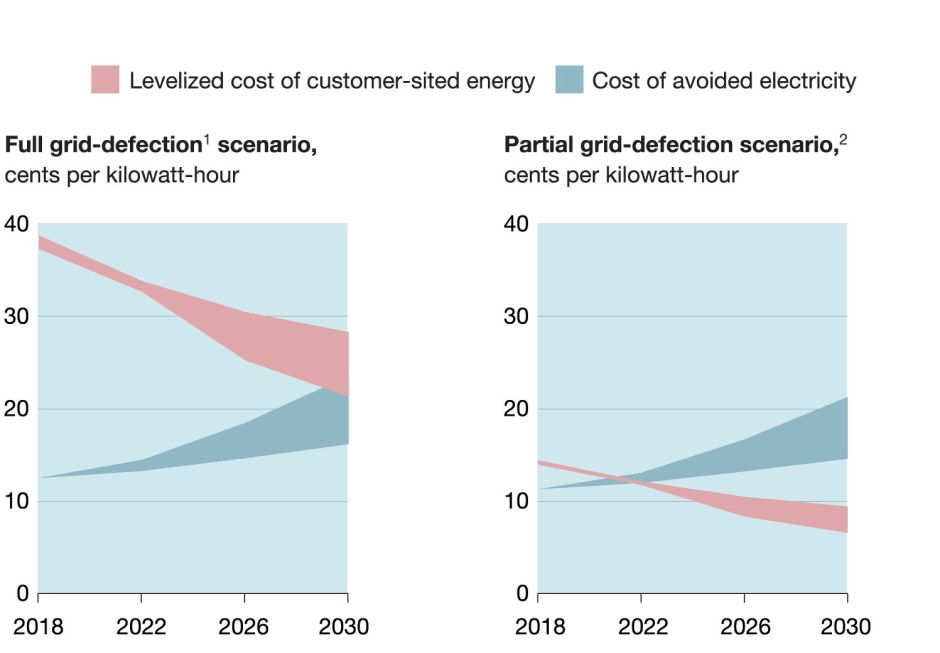
Cutting the cord?
Some advocate having a home PV system with storage that is large enough to disconnect from the utility. For most families, this is simply not economically practical. Residential energy needs have a summer and a winter peak (low spring and fall usage). The winter peak corresponds with lower levels of sunshine (and longer periods of cloudy weather). A careful analysis of expected worst case PV system output on a monthly or even daily basis vs. the expected energy needs will determine the required system component sizes and the costs. This also means that any excess PV output that exceeds storage will have to be controlled by regulating equipment (simply disconnected) as seasonal energy storage is not likely to be practical. A reliable standalone PV system may cost more than the residence, if it can be installed on the property.