This discussion is limited to simple residential or small commercial utility connected PV systems without storage. The situation is complex. If a PV system is too large to be economical, the owner is stuck with it. Smaller systems can be enlarged. Rates below are as of January 2019. The smaller electrical suppliers such as municipal systems and co-operatives are not covered in this article. If corresponding information is submitted to the Solar Center it will be included.
General considerations:
- How many PV modules can be installed on a roof or ground mount
- Shading by items on roof or trees
- Orientation and tilt
- Tradeoff of higher efficiency (higher cost) PV modules
- Multiple orientations vs. inverter technology (ability to mix orientations)
- Available roof area generally limits the array size
- How much current can be fed back to the utility depends on several factors:
- There are two basic connection methods per the National Electrical Code (NEC), Supply Side (also called Line Side) and Load Side (more common, connected via a circuit breaker in the main service panel).
- Load side connection is limited to using an inverter(s) that have a maximum output such that the sum of the inverter outputs multiplied by 125% is less than 20% of the listed ampacity of the buss conductors in the main service panel. (for example: a 7.7 kW inverter with a maximum output of 32 amps x 125% = 40 amps requires a 200A service panel if the main circuit breaker is 200 amps.)
- Larger Load Side connections are possible if the rating of the main circuit breaker is reduced (load calculations by a licensed electrician required).
- Upgrade the main service panel to a solar ready panel.
- Consider a Supply Side connection. Usually difficult on residential unless the meter and panel are separate enclosures (not the more common all-in-one design).
- Consider the economics that vary with the utility and selected rate schedules:
- The utilities have different rates and requirements. The main considerations are utility purchase rates for any excess production (PV output at any time exceeds the energy consumed, Fixed charges based on PV rating or inverter rating, and demand charges. Time of Day rates may further complicate the analysis.
- Take APS as a starting point since their policy is more pro solar than SRP or TEP. The days of residential net metering are now long gone, APS now uses meters that measure the instantaneous export power and APS credits this monthly at $0.1161 per kWh (for new PV systems with applications completed before August 31, 2019). APS On-Peak Energy Charges in the Summer range from $0.24314 down to $0.05750, depending on rate schedule and the corresponding demand charge. A simple summary is available at https://azsolarcenter.org/summary-of-residential-rate-plans-for-aps-customers-with-an-on-site-distributed-generation-system. It is difficult to determine an optimum rate selection. One factor to consider is that APS charges a monthly Grid Access fee of $0.93 per kWdc of the PV array rating. This adds up over the years and needs to be considered when deciding on an array rating.
There are residential PV system size limits: The PV array nameplate capacity cannot be larger than the following electrical service limits:
a) For 200 Amp service, a maximum of 15 kW-dc.
b) For 400 Amp service, a maximum of 30 kW-dc.
c) For 600 Amp service, a maximum of 45 kW-dc.
d) For 800 Amp service and above, a maximum of 60 kW-dc
For commercial systems APS offers net metering (Rate Rider EPR-6) and has a size limit that the facility’s nameplate capacity cannot be larger than 150% of the customer’s maximum one-hour peak demand measured in AC over the prior twelve (12) months.
- SRP is different. Residential solar customers are required to the use the E-27 rate schedule with its high demand rates, but low energy rates. Any monthly excess is credited at $0.037 to $0.0633 per kWh, much lower than APS. SRP does not have a monthly fee based on PV array or inverter size. If the PV system is over-sized, the excess energy is only worth $0.037 to $0.0633 per kWh.
For commercial PV systems SRP uses an hourly net metering procedure (BUYBACK SERVICE RIDER) in which any excess balance each hour is purchased by SRP at the Hourly Indexed Energy Price - $0.00017/kWh, basically the wholesale energy price at Palo Verde less a small handling charge. This averages $0.020 to $0.030 per kWh. This procedure makes it difficult to accurately forecast value of any excess credits.
- TEP will pay new solar customers 9.64 cents per kilowatt hour (kWh) for their systems' excess power, a price that reflects average market costs over a recent five-year period. Customers who file applications after Sept. 20, 2018 to install private rooftop solar systems will keep their initial export rate for up to 10 years. The export rate will be updated annually to reflect market prices for solar power, but will not be allowed to fall more than 10 percent. New solar customers also can choose from two existing Time-of-Use pricing plans, which offer lower rates during most of the day, on weekends and holidays. TEP offers Fast Track™ easy approval for simple PV systems of 10 kWac or less.
- Some utilities in Arizona, such as tribal based utilities do not pay for any excess energy, but allow the back feed.
Other considerations.
- A typical residence will use 6,000 to 20,000 kilowatt hours per year on average. A typical older small well insulated home in Phoenix that is basically unoccupied during the day uses 9,253 kWh per year. Most homes have a 200-amp service entrance and as such can only connect inverters of 7.7 kW (Load Side connection) without expensive alterations. A 7.7 kW inverter can handle PV arrays of up to about 11 kW. An unobstructed South-facing 11 kW array will produce about 17,600 kWh/year.
- For Phoenix weather a South-facing 1 kW array at a tilt of 10° will produce about 1,600 kWh/year. Face the array to the East or West and the 1 kW array at a tilt of 10° will produce about 1,500 kWh/year. Please do not think about facing the PV array to the North, a waste of good equipment.
- Increasing the tilt up to about 30° increases annual output, but reduces summer output when the energy is more valuable.
- Minimum tilt is 5° to avoid dirt build up along an edge or corner.
- Use of PV arrays larger than the inverter nominal rating (consult manufacture specifications for maximum PV array size for the inverter) can result in “clipping” when the PV array output exceeds the maximum power rating of the inverter. Difficult to estimate, but common in the spring and fall when the array rating is more than 110% of the inverter rating.
- Demand charges- If a rate with a demand charge applies, the PV system may reduce the demand charges if the demand coincides with the solar resource.
- Costs and savings.
- The major installation cost components are:
- PV modules
- Inverter(s)
- Structure to mount the PV modules
- Required disconnect switches and meter base
- Wiring
- Other electronic parts such as optimizers and rapid shutdown devices
- Design, drawings, and permits
- Federal Tax Credit
- Arizona Tax Credit
- Any financing or lease related costs
- Operational or monthly costs- APS charges a monthly Grid Access fee of $0.93 per kWdc of the PV array rating.
- Reduction in purchased utility energy- The output of the PV system will be used to first reduce the local load and any excess and any excess will be exported to the utility. The value of this reduced purchase of energy (and related fees and taxes) is the energy price for the customer at the time period as per the discussion above.
- The various utilities have different policies on credits for any excess energy:
- APS Residential- Calculates a credit at the fixed rate shown above (@0.1161/kWh).
- SRP Residential- Any monthly excess is credited at $0.037 to $0.0633 per kWh, depending on the rate in effect at the time the excess was generated.
- TEP Residential and small commercial - Calculates a credit at the fixed rate shown above (@0.0964/kWh).
- APS Commercial- Annual net metering with any excess credit as a monetary bill credit at the end of the year at the fixed price of $0.02895/kWh.
- SRP Commercial- Hourly credits are the product of the hourly energy sold to SRP and the adjusted Hourly Indexed Energy Price (market price), generally $0.020 to $0.030 per kWh.
- See our article "Arizona Electric Utility Information" for information on the smaller electric utilities/Co-ops.
- Summary
- While several services and software packages can estimate the PV array output, it is difficult to accurately estimate how well it will coincide with the building energy need.
- The benefit of net metering is that this mis-match between solar generation and load is less important.
- The larger the PV system, the larger the percentage sold as excess to the utility.
Of course it is not this easy, there are other considerations in a PV system design. Some further items that the PV system designer may need to consider:
- The layout of PV modules on a roof needs to be considered:
- The Authority having Jurisdiction for building permits may require a structural engineer report on the ability of the roof to accommodate the additional weight and wind loading.
- The input requirements of the inverter such as voltage limits and ability to efficiently connect PV modules installed at differing orientations. The situation may require use of microinverters (one per PV module, or other electronic devices.
- Any equipment needed to meet the rapid shutdown requirements of the adopted version of the NEC.
With all the above information, the Solar Center recommends the following procedure:
- Gather at least one year of electrical bills and extract the monthly energy used in kWh, the cost, and if applicable demand data. The utility may be willing to help you on this.
- Decide on some basic objectives. It is not simply “reduce my cost of electricity”, but may include a willingness to help improve the environment, etc. There are purchase and lease alternatives to consider.
- Get input from several experienced solar installers, try to avoid high pressure sales by marketing organizations. Deal only with licensed installers. Arizona law places the primary warranty responsibility on the installer, not on any company that may have sold the system and contracted actual installation to others.
- Free services such as Google Earth have good 3-D images of most metropolitan areas of Arizona.
- Determine:
- The maximum PV array size that will fit the structure per the guidelines above.
- The maximum inverter size that can be connected to your main service panel.
- Make sure the bids conform with #5 above.
- Ask for both monthly and annual projection of PV system output and estimated savings (based on the rate schedules and excess buyback policy of your electric supplier.
- Compare this with your objectives.
- Ask many questions about the make/model of the offered PV modules, inverters, and equipment warranty.
- Ask about small and larger systems to determine the relative expenses and savings.
- Arizona laws- Consumers buying, financing or leasing a solar distributed energy generation system (“System”) must receive certain disclosures from the manufacturer and solar installers regarding warranties, payment obligations, performance data and major System components as set forth in A.R.S § 44-1763. A good example of this is the APS form https://azsolarcenter.org/images/PDF/APS-Consumer%20Acknowledgement.pdf
- Discuss the proposed system with your utility. SRP and APS offer reasonably good advise and can advise on the best rate tariff for your situation, they have access to your history. TEP is less approachable as they do not accept phone calls to the solar department, send an email to This email address is being protected from spambots. You need JavaScript enabled to view it..


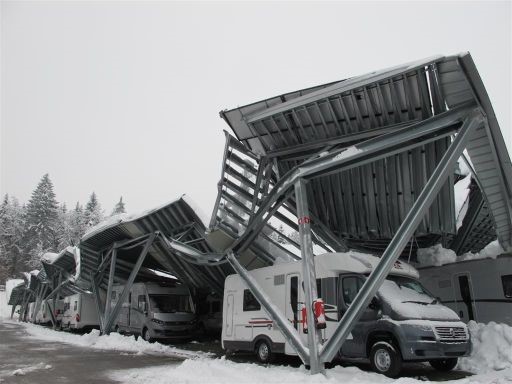
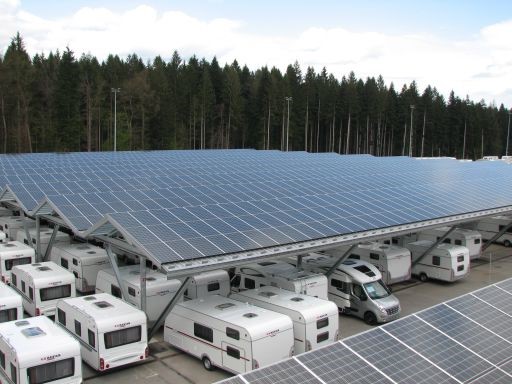 In 2012, motor home manufacturer ’Adria’ built this fancy new 1MW solar plant over its parking lot.