

Caution- This may be out of date, APS may have changed their website. APS customers can call APS Customer Service and they can help you with finding your data.
If you have a photovoltaic (PV) system connected to APS and do not have other monitoring of the PV system such as that provided by most inverter manufacturers, it is not easy to determine the solar production that corresponds with the monthly electric bill. APS requires a solar production meter and this data is recorded and made available to the customer, but with a little effort. The following example is based on the system APS calls RCP, utility speak called 'Resource Comparison Proxy' (note that the APS website was developed by utility personnel using their view of the situation, not the customer view). Under RCP APS purchases all excess PV output at a fixed rate. Some APS customers with older PV systems use the now grandfathered 'Net Metering' (rate rider EPR-6) wherein any excess PV production, measured in kilowatt-hours (kWh) is used to offset energy delivered by APS. For either Net Metering or RCP, the APS bills show only the measurements made by the bi-directional billing meter. A summary of APS rates is available on our website at: Summary of APS Solar Rate Plans- 2019
Look at the recent example of an APS electric bill and see if you can determine the solar production (not shown):
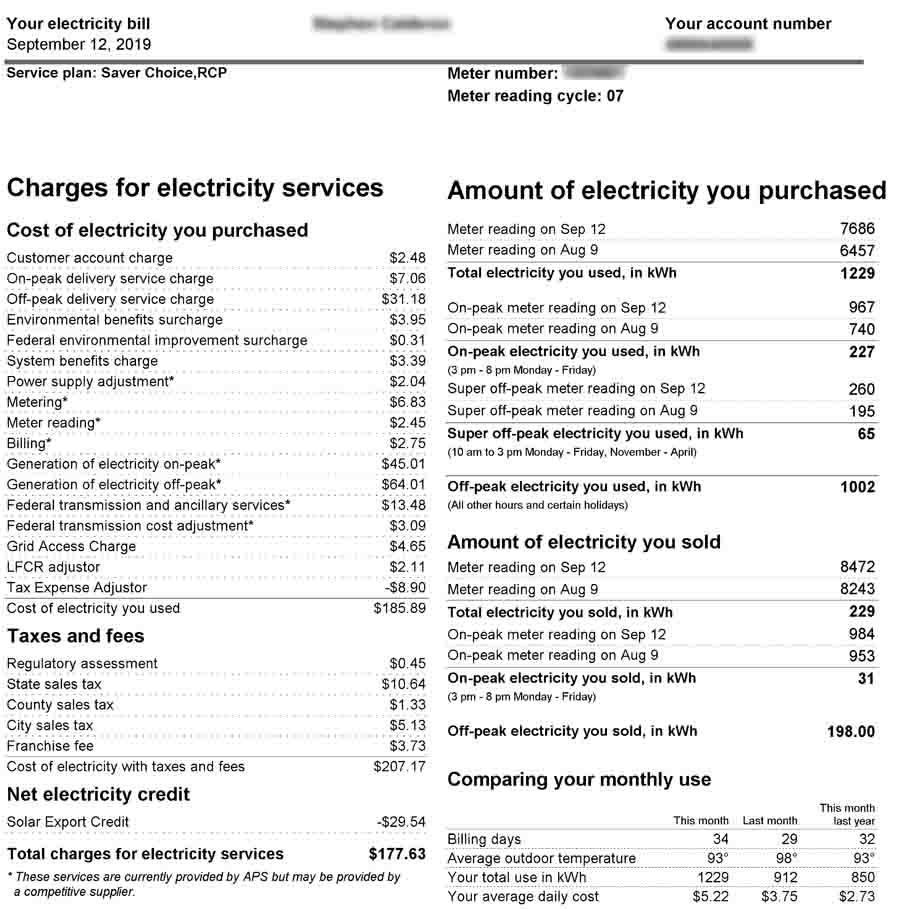
This APS bill shows that 229 kWh in this case was sold to APS under the RCP rate. The bill does not show the solar production that was directly used; to determine this, one has to have an APS web account (free) and has to go online to learn more. There is a lot of data available. Note the 'Meter reading' dates above, this will be used later to calculate the matching solar production. Using a browser such as you are using to view this article, go to https://www.aps.com/
The APS website was recently updated. The top of the page has a Log In.


Enter your APS username/password then click login. If you do not already have a username and password, click on 'register'. The following is typical.
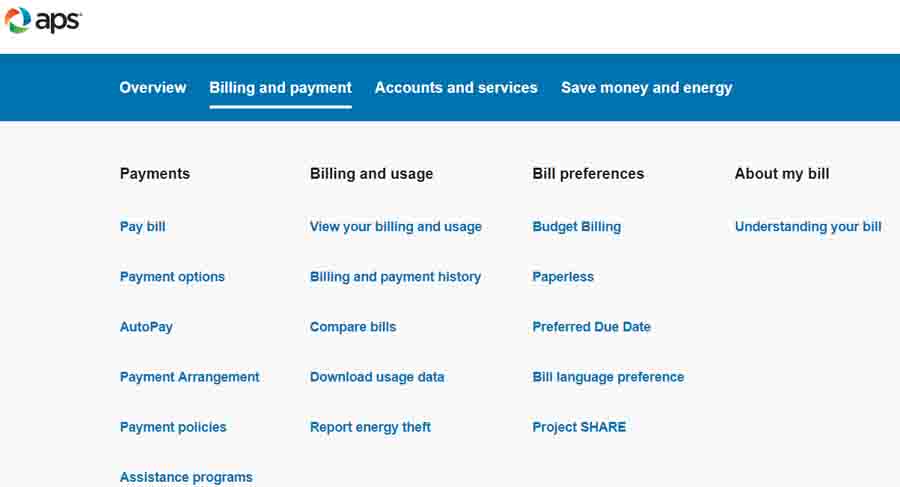
Next select the tab 'Billing and Payment', then click on 'View your billing and usage'. Be patient, this may take a minute or so while the APS website loads your data.

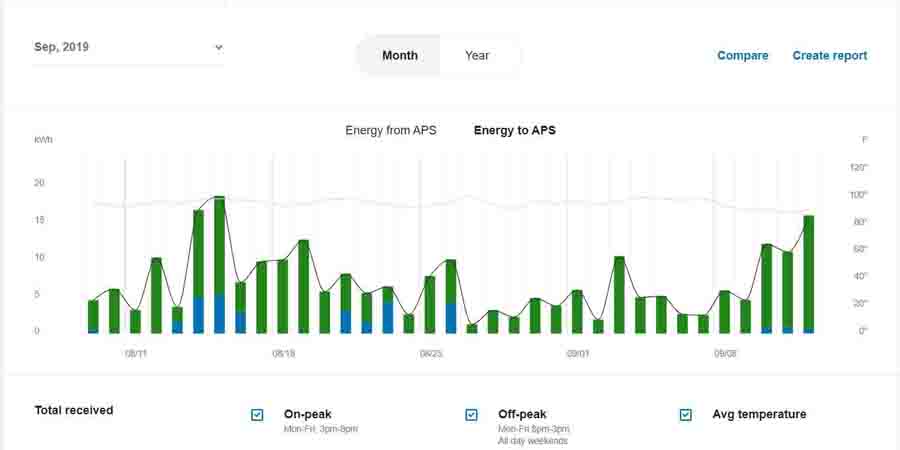
This is a very useful page. There are really two related pages, 'Energy from APS' and 'Energy to APS'. The above is 'Energy from APS'. Further detail is available by positioning the cursor over a specific date, this produces a pop-up with details:
 |
In this pop-up: Total Produced = PV energy generated Total Delivered is energy from APS and the On-peak and Off-peak components are shown. |
Selecting the 'Energy to APS' tab shows the solar components:
 |
In this pop-up: Total Produced = PV energy generated Total received is the daily excess energy sold to APS (if RCP) or net Metered to APS. |
Each of these pages has a 'Create Report' button.
 |
There are 3 options: Download graph data: This will provide daily values Billing and usage data: Peak usage data: |
The 'Download graph data' option downloads a file named downloadGraphView (y).xls wherein the 'y' is used if there are subsequent downloads. These files have a header and 35 days of data. If prior data is needed, simply select an earlier month. Typically the data will look like this (two months illustrated):
(Note: Windows 10 identifies these files "The file format and extension of 'downloadGraphView (2).xls' don't match. The file could be corrupted or unsafe. Unless you trust its source, don't open it. Do you want to open it anyway?". Seems that the actual format is not .xls, but Excel loads the files.

The values for the billing date range, July 25 to August 23 in this example, need to be added. This can be done with the spreadsheet program or manually. In this example the sum is 711.5 kWh. This is not straight forward since the values shown are actually text and Excel can not directly add them. Use the =value(cell) function in another column to convert the text to actual values. Now that the actual solar production is known, the below chart shows the relationship of these values.
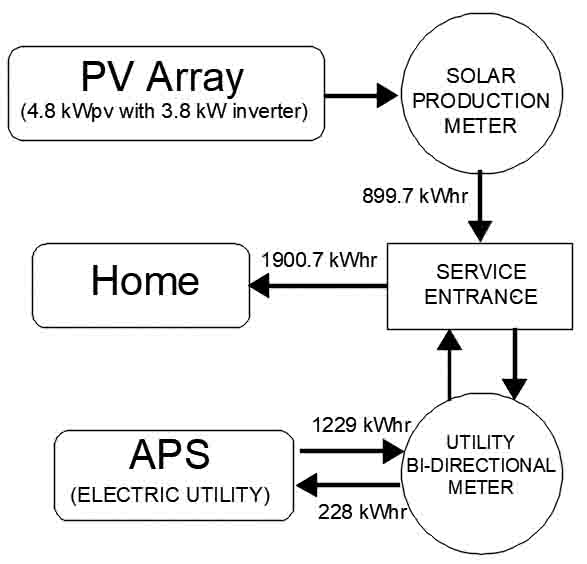
The calculation of Home useage is (Solar Production) + (Purchased from APS) - (Sold or net metered to APS).